Claims Reporting

Everything you need to know, all in one place.

Stop bottlenecks before they become delays. Our claims processing software delivers custom reports and dashboards that keep your life, annuity, and living benefits claims moving at peak velocity.
Teal shield icon with a check mark inside, symbolizing security and verification.

Ensure audit-ready compliance

Yellow line chart with an upward trending arrow indicating growth or increase.

Increase forecasting precision

Blue lightning bolt icon.

Access real-time insight

A screenshot of the Benekiva reporting dashboard showing how our claims management system transforms raw data into real time insights and actionable analytics.

Your Entire Process In One View

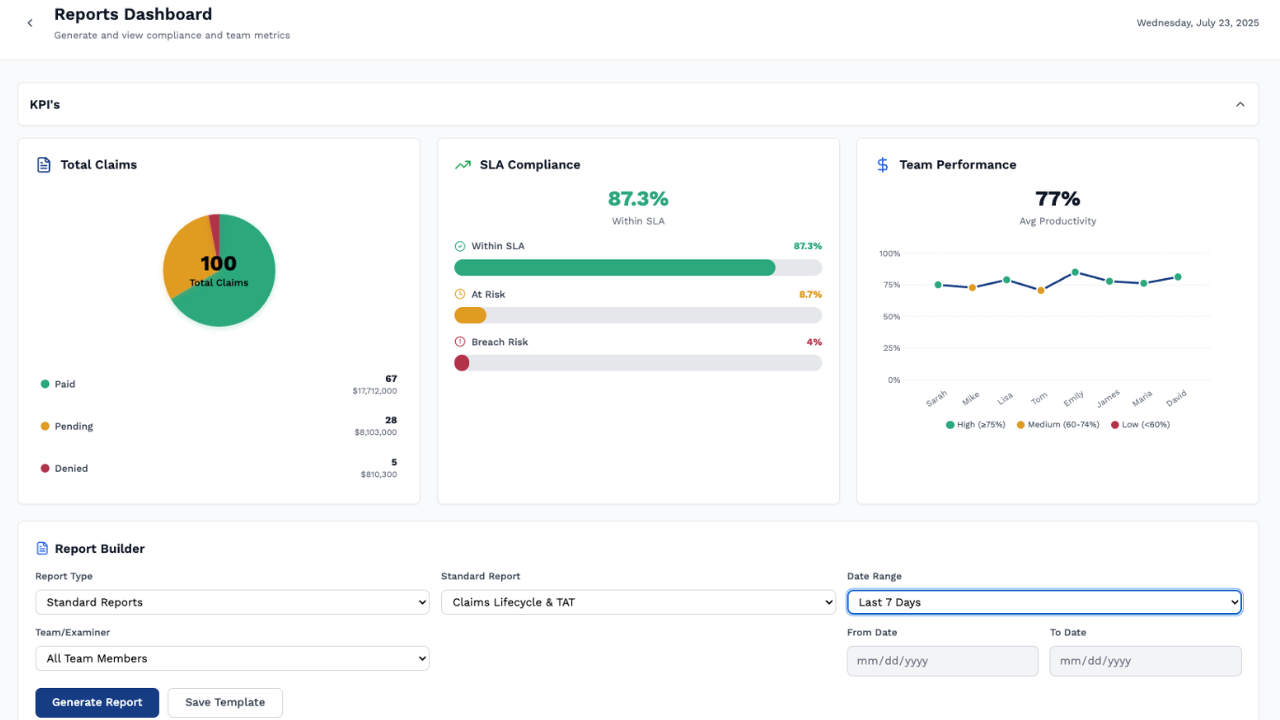
Benekiva helps you make sense of the noise by turning daily data into updates you can actually use. By tracking the right data points, we help your team see exactly where they stand. Our dashboards give leaders the confidence to lean into claims automation software to balance workloads, cut down on delays, and keep things moving smoothly for the people who need it most.

Simple yellow bar chart icon with three vertical bars of different heights connected by a line.

Start With
Pre-Built Reports

Access pre-built reports designed for claims operations. Get the data you need immediately without having to set anything up.

Icon of a document with a checkmark symbolizing file verification or approval.

Build the Views You Need

Tailor reports to show the exact metrics that matter most to your team.

Yellow outline icon of a wrench with an open-ended jaw.

Create Dashboards for Any Role

Build personalized dashboards that display real-time information relevant to each role and responsibility.

Teal clock icon showing 3 o'clock.

Run Reports on Your Schedule

Run reports as needed or schedule them to hit your inbox automatically.

Yellow clipboard icon with a checklist.

Report on Any Data Point

All data in Benekiva is available to report on, giving you complete flexibility in data analysis.

Two connected square shapes with rounded corners in teal color forming a simple workflow icon.

Act on Real-Time Data

Make decisions based on what is happening now. Dashboards and reports update in real time so you’re never behind.

Ready to Transform Your Reporting?

Let's Connect

Explore More Solutions

Discover how Benekiva's comprehensive platform can transform your operations.

White gear icon at center connected by lines to surrounding circles on a blue rounded square background.

Data Enablement Framework

Unified data flow for clean, reliable reporting.
White calculator icon on a rounded yellow square background.

Interest Calculator

Simplify interest calculations with precise results every time
White clipboard icon with three checklist items on a teal rounded square background.

Claims Workbench

Modernize claims operations for efficiency, accuracy, and better customer outcomes.